A very special event indeed, what a time to be on strike. As of writing this, I’m still making up some strike pay hours. Nonetheless, I was extremely fortunate to view totality at a relatively clear location some hours away from where I am normally situated.
I went equipped with:
eclipse glasses
sandwich materials and some chilled diet coke
a sweater
and a lot of patience
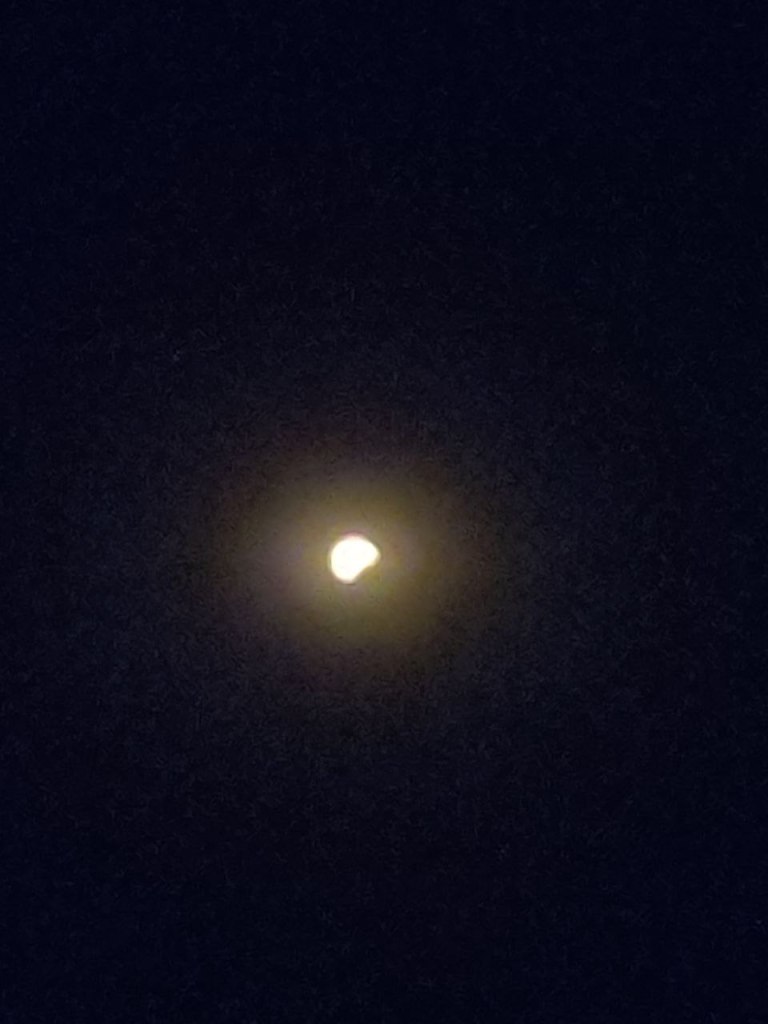
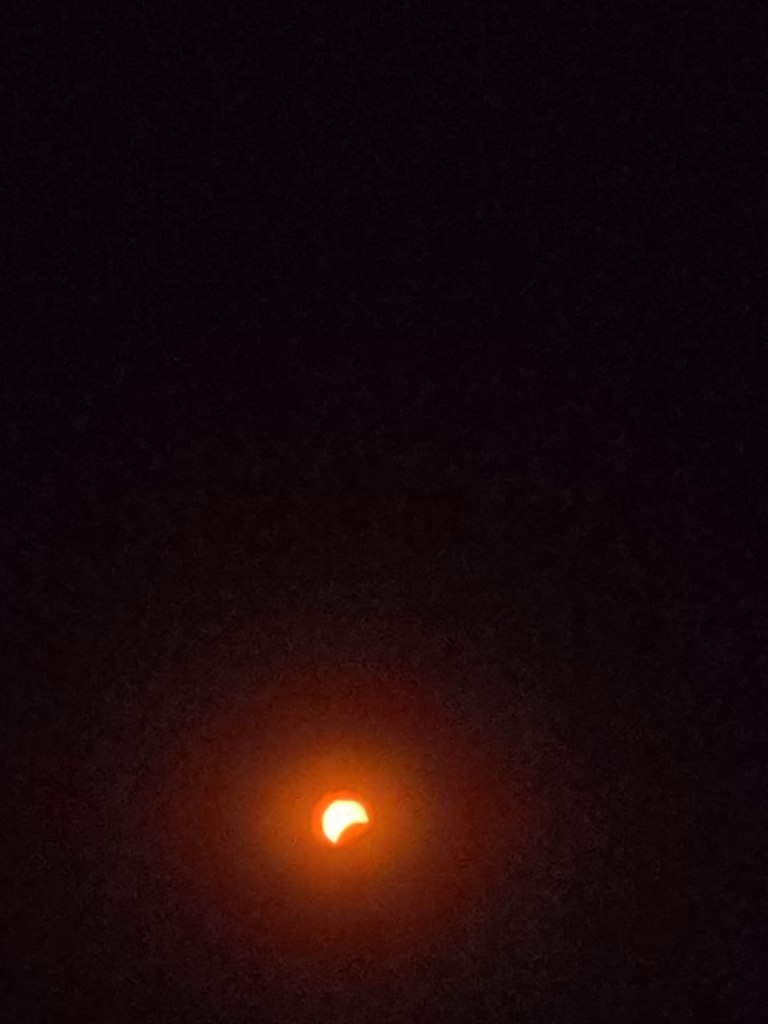
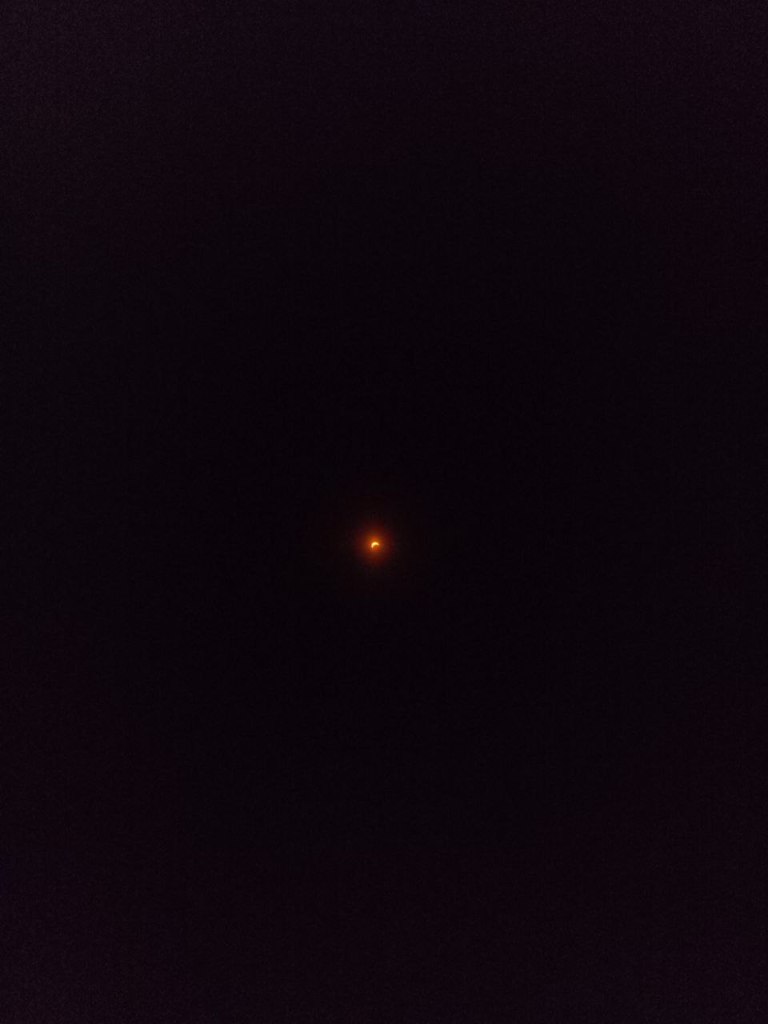
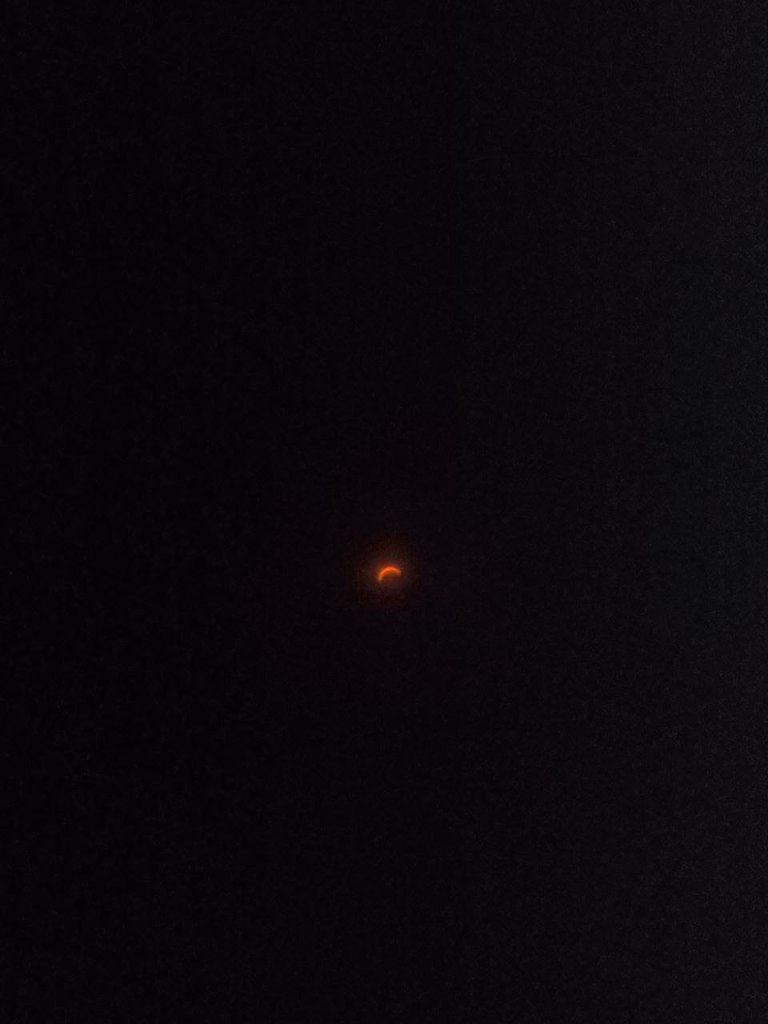
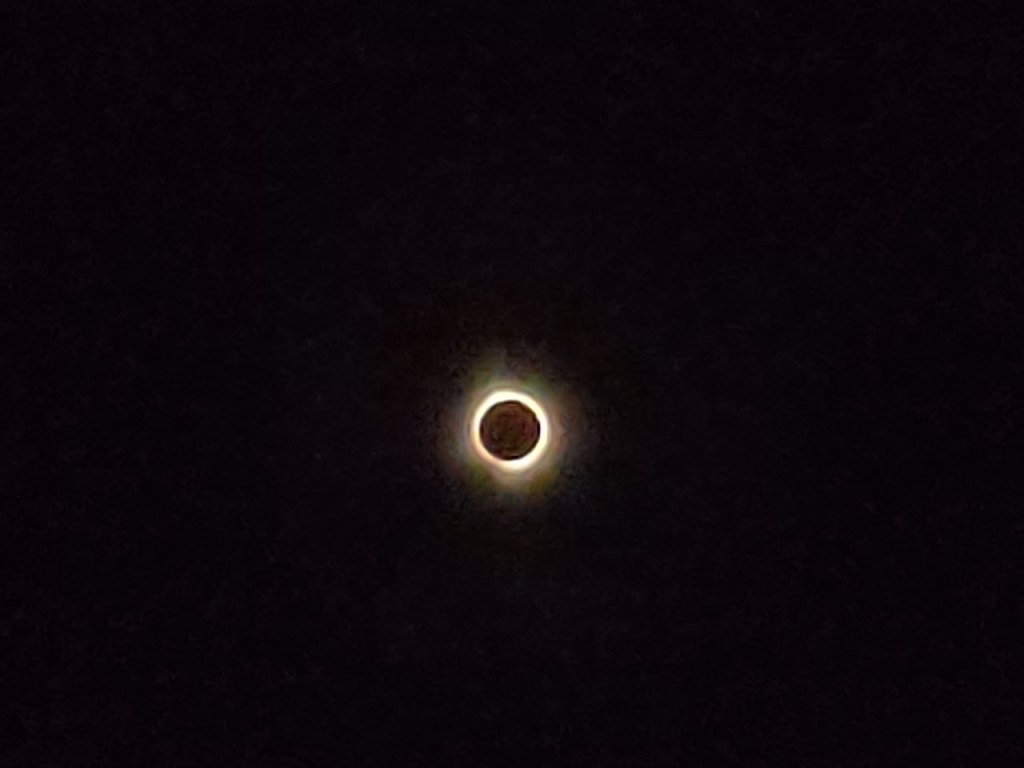
We managed to find a park with an available bench to have the pre-eclipse picnic, then started checking through the glasses periodically, trying to find when the first visible blip over the Sun would happen (I had forgotten the specific times, and didn’t feel like looking it up). Here are some photos I took during the progression (Fig. 1).
Figure 1. Eclipse progression from left to right, top to bottom. All images where taken with eclipse glasses over cellphone camera.
For the most part, I was taking images through my cellphone camera and the glasses. Some branches did get in the way to make it difficult, but it was a fun exercise.
I had a burst of inspiration halfway through the eclipse and pulled out the photometer on my cellphone, laying it flattish along the arm of the bench. It registered around 50k lux around the midway mark. I checked on this periodically, with the value falling off during cloud passage or shadowing (inference, at first I thought it was just the eclipse progressing quickly!). When totality neared, the radiance value plummeted to a few hundred, and dropped further to single digits.
A couple of days later, it occurred to me it might be interesting to plot those values and see what it might look like. On top of that, was there some way I could estimate the incoming flux based on first principles? How accurate were my readings from my phone in comparison to weather stations? Let’s say I didn’t get far, but here is what happened.
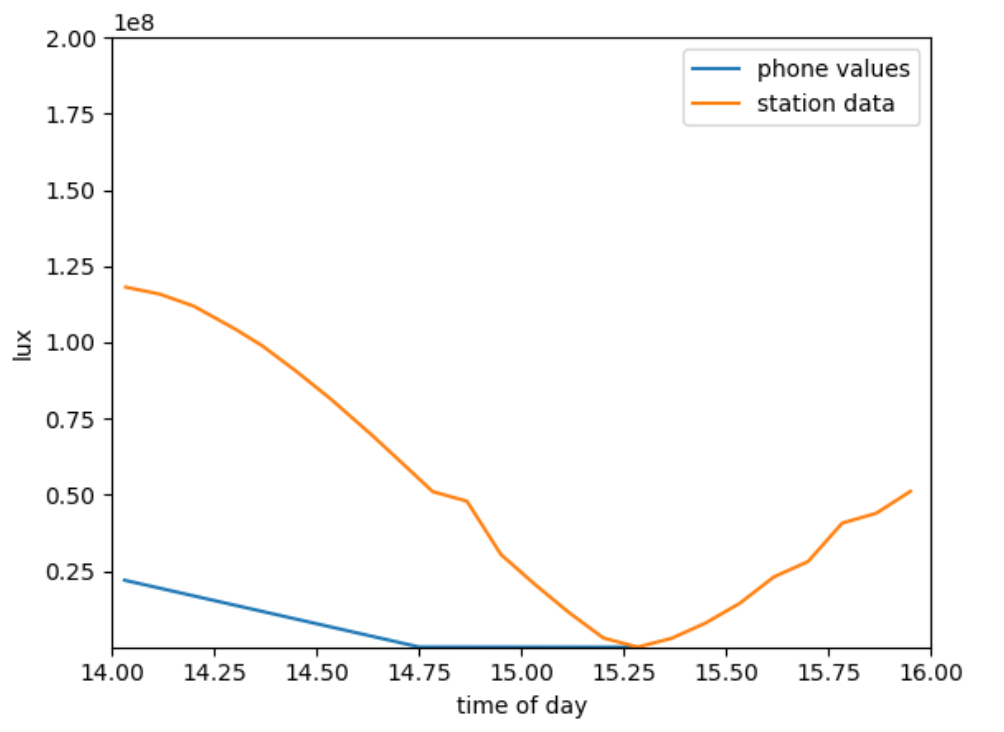
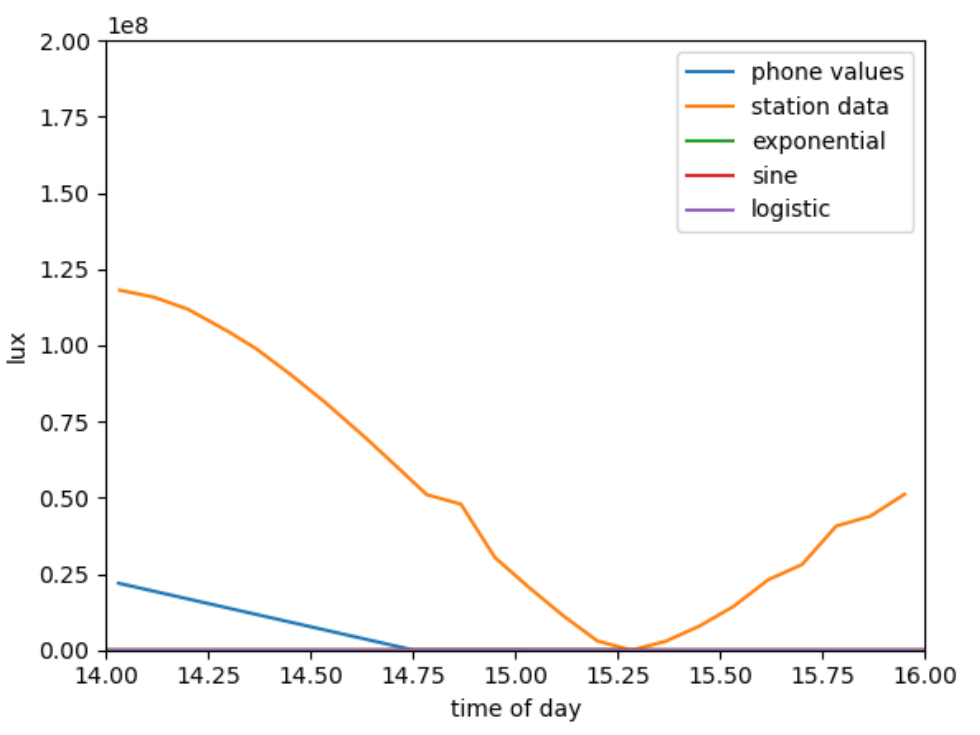
Here’s how I tried going about it. The first is getting the total incoming flux at the top of the atmosphere and how much is getting through the ground. I added some values from the typical incoming solar radiation and then some specific incidences at a nearby weather station. Clearly they were quite different from each other (Fig. 2). Nontheless, I also tried fitting the data points I took. I tried a few different curve fits and ended up with mildly ridiculous fits (Fig. 3). Intuitively, I had been expecting something like a sigmoid function to align well, though I received a suggestion for a gaussian fit to align with what we see from transits instead, which in retrospect, makes quite a bit of sense. However, this fell to the backburner and I didn’t get quite anywhere.
Figure 2. Nearby station data plotted over the 2 data points collected on site.Figure 3. Miscellaneous fits to the site collected data.
I don’t have much of a conclusion to this other than, a cellphone probably does not replace a pyrometer, and three data points does not make for a good fit.
Welcome to my first post! Here I tell you about one of the silly things that I get up to when I’m sick and don’t quite have the capacity to focus on regular work.
Disclaimer: I am by no means a medical professional. No advice is being offered in this article. This article is intended to be humorous and demonstrate some basic techniques to pull data from images.
Acknowledgements: My family for taking me in when I was feeling unwell and insisting I eat well during the bout of COVID I got. They also got extra tests for me when I wanted to be consistent about the materials I was using for this study.
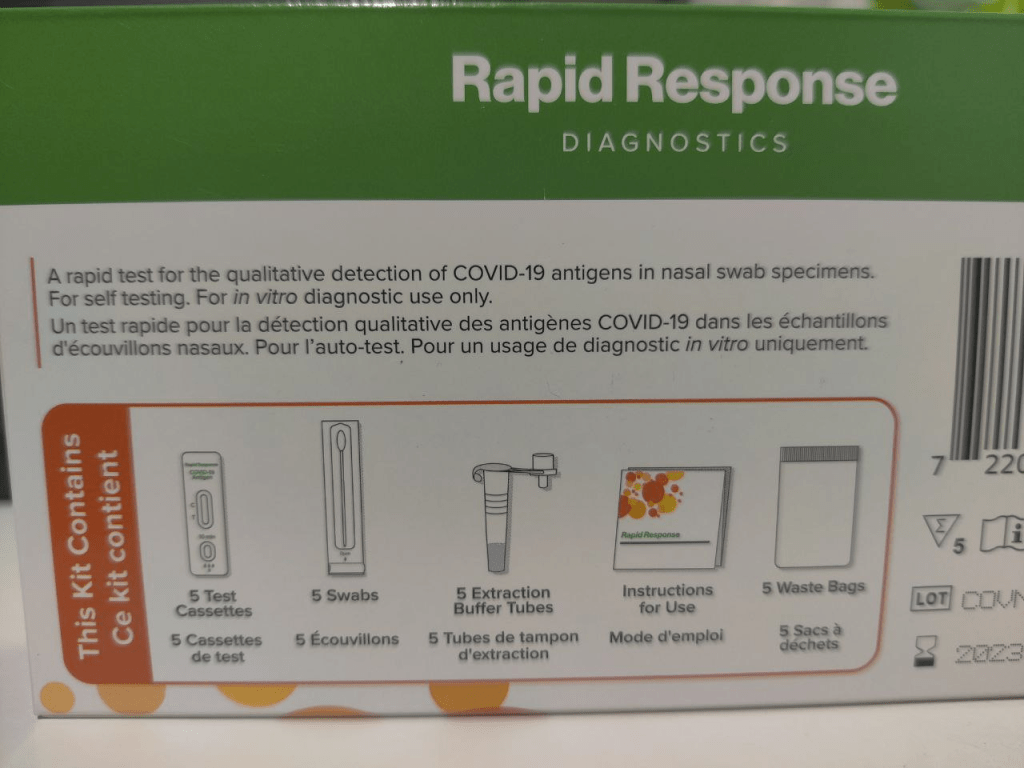
Materials and Methods: COVID-10 Rapid Tests (Rapid Response Diagnostics, Rapid Response (R) COVID-19 Antigen Rapid Test Cassette for At Home use) retrieved from various Shopper’s Drug Mart pharmacy sections. 11 samples were taken. 2 blanks were discarded following calibration. Samples were taken every 24 hours with up to 5 hours difference from the 7 pm ET reference time. Figure 1 demonstrates the contents of each box of tests.
Figure 1. Back of the Rapid Response (R) COVID-19 Antigen Rapid Test Cassette. Image provides brief description of the purpose of the contents and an illustration of the contents of the kit. Included are 5 test cassettes, swabs, extraction buffer tubes, and waste bags. Instructions for Use are also included.
To create the sample, the provided swab was inserted into the right nostril until the swab encountered the back of the nose and swirled several times to collect mucosal liquid. The same swab was applied to the left nostril in the same manner. The collected fluid on the swab was then swirled into the pre-packaged test vial. The test vials (buffer extraction tubes) in all cases were vials with a foil seal, retaining the buffer. The buffer soaked into the swab was removed from the swab via pinching of the plastic tube as the swab is pulled out. Unlike previous iterations of the tests, the swab could be removed immediately after soaking and mixing of the fluids. The buffer vial had an attached lid with a nozzle. The lid was attached after the swab was removed and 3 drops were squeezed onto the sample plate. 10 minutes after the initial drops were applied, the sample result was observed. One red line next to the “C” symbol indicated that the test was functionally normally. One red line next to the “T” symbol indicated that the result was positive. No other anomalies indicated that the sample results were reasonably reliable. Detailed instructions can be found at btnx.com/covid19athome.
The tests were taken beginning on Oct 3, 2022 back when the test subject woke up with a fever. 2 samples were taken during the first 36 hours (midday 1, evening day 2). Both tests resulted in “negative” scores on the rapid tests. These tests are not included in the visual analysis of the COVID positivity progression and were used to calibrate expectations. The third test was taken in the evening of day 3 and resulted in a faintly positive score. Subsequent tests were taken in the evening each day. The tests were aligned each night and it was observed that while the fabric/wicking material of the samples were drying out, the intensity of the red lines remained similar to their initial conditions at the end of the 10 minute waiting period. Images of the collected tests were taken using a OnePlus8T+5G phone using the default camera settings. The lighting available for the image was a 3 panel white LED approximately 20 cm above the middle of the samples. The photos were taken after nightfall and with no other illumination sources.
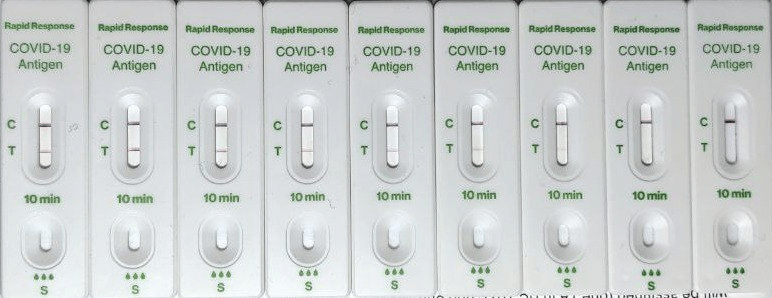
The selected “best” image was cropped to only include the samples to reduce any external interference (Fig.2). As the image was taken with a relatively perpendicular shot, additional skew was not required for the image. Boxes where the reference line (C-line) and the test line (T-line) were selected. The RGB pixel values were extracted from the the boxes for the 10 samples that were aligned next to each other. The values from the C-line and the T-line were then compared to each other in a few different ways to demonstrate the progression of having COVID to testing negative.
Figure 2. Cropped image containing results of the COVID19 Rapid Tests as taken by a cellphone camera. The last two tests are negative (no visible reading in the T-line).
Results: The RGB values were selected in pixels in xy dimensions of x by y pixels. This resulted in 100 pixels in each box selection. Isolating only the R-value for the C-lines (which one would potentially expect to be the most useful) provided a clear pattern where the R value is lowest when the pixel includes the C-line. In retrospect, this should be fairly straightforward to understand as the “white” background pixel is created from high values of all RGB components (256).
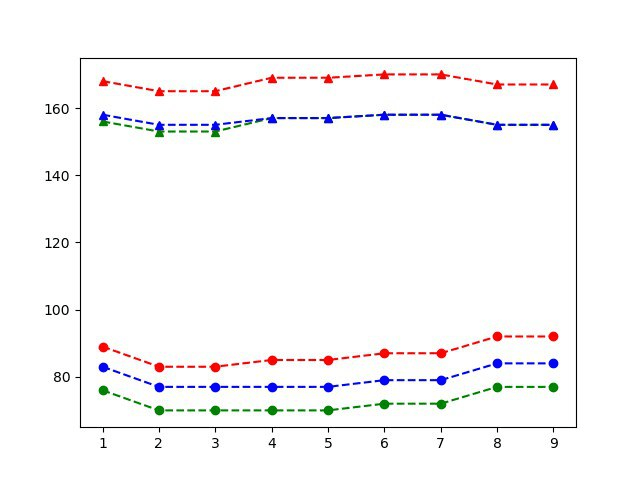
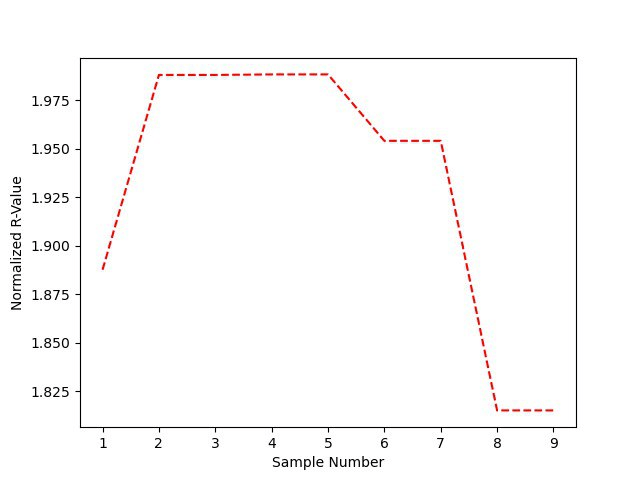
A plot of the maximum RBG values is shown for each one of the C- and T-lines in Figure 3. A clear maximum value for the T-line can be seen from each RGB component from samples 5 and 6 with a steep fall-off towards a minimum value with sample 8. Figure 4 shows the “normalized” R values for the T-line based on the minimum R-value in each sample test and scaled by the minimum R-value from the C-line.
Figure 3. Minimum RGB values in the area for the C-line (circles) and T-line (triangles). The difference in value can potentially be attributed to unbalanced lighting.Figure 4. Normalized R-values for each sample (minimum R in T-line divided by minimum R in C-line).
Discussion: Visual inspection of the COVID19 Rapid Tests would suggest that there was a rapid increase in the “redness” of the T-line in the first 3 days, with a slow taper off. It is possible that the saturation of the red is actually quite similar from test to test, and it is the thickness of the T-line that varies. In such case, checking the contribution to the R-value is not a useful indicator of “positiviness”. Instead, the thickness of the lines should be considered. In addition, there were no redundant samples. Future studies should consider 3 rounds of swabbing and taking the average metric of each sample run.
Conclusions: A faint positive is still positive. COVID sucked, but I was fortunate enough to not lose my sense of smell for too long (likely a blocked nose). We shall see about long-COVID.
References: Me.
Editor 2: …
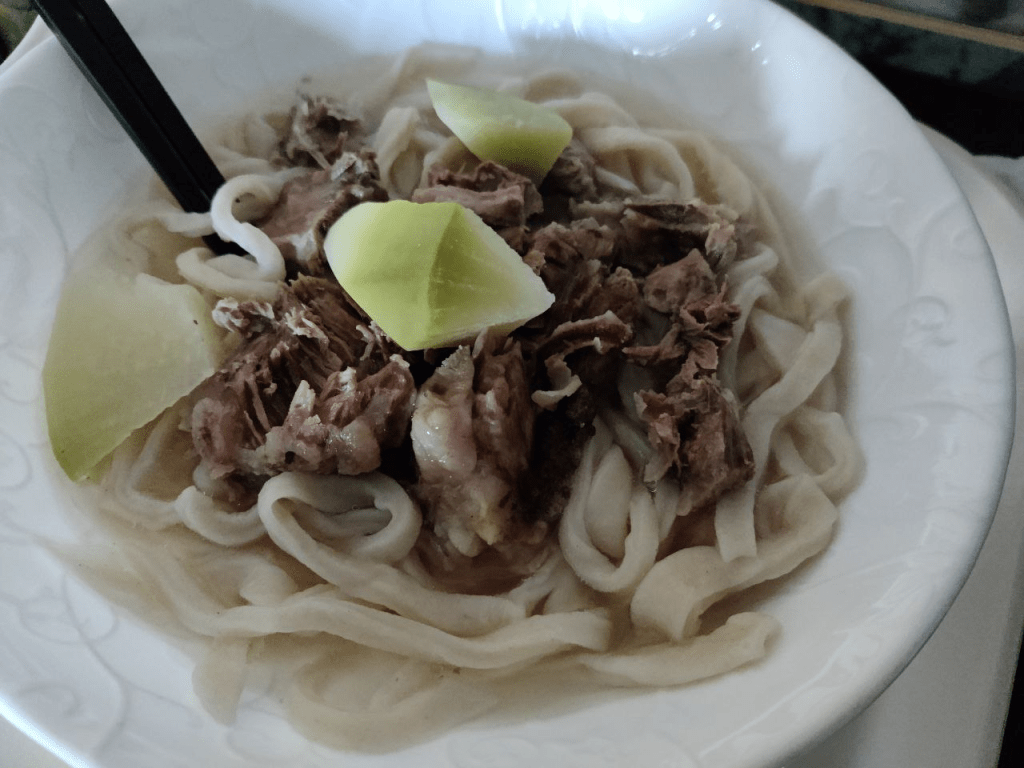
Supplementary Material: Images from homemade meals during this time are included in this section. Image S1 includes a noodle soup with noodles made from scratch (I think). Image S2 is a mysterious fried rice concoction.